Hans Lugtigheid
Theoretical model
With the pandemic we see that the number of covid deaths are usually not equal to the observed excess mortality. This raises the question how to get a good insight in total excess mortality. This article shows how to get a full overview on excess mortality and covid mortality.
First observe that excess mortality can be divided in mortality from covid and mortality from other causes than covid (non-covid). Also note that excess mortality refers usually to the annual excess mortality which equals actual mortality in a year -/- expected mortality. Call this ‘year-on-year’ excess mortality.
There are also people who were expected to die in, say, October but who died in April from covid. For April this is excess mortality, fro October this counts as negative excess mortality (deficit) and for the whole year this counts as zero excess mortality. Call this ‘in-year’ excess mortality.
Whith this we can make an overview of all excess mortality. See the table.
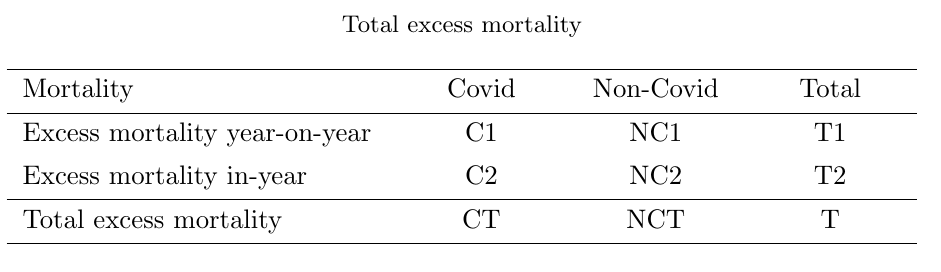
With the variables C stands for Covid, NC stands for Non-Covid and T stands for Total.
At the end of the year we can fill the table with the appropriate figures.
We (should) know T1 from the expected mortality and actual mortality.
Also the number of people who died from covid, CT, is known at he end of the year.
First estimate C1 and NC1. Assume that the statistics bureau estimates that most excess mortality was due to covid. This looks realistic for (at least) the first year. So for a first ‘ball park’ estimate we could attribute, say, 90\% of excess mortality to covid and 10\% to non-covid. The non-covid could come from delayed visits to the doctor etc.
So in this case C1 = 0.9*T1 and NC1 = 0.1*T1 for a total of T1.
C1 + C2 must equal CT. C1 and CT are now known, Hence C2 = CT-C1.
NC2 pertains to people died earlier in 2020 from other causes than covid. For example older from stress/psychological reasons. Their number is difficult to estimate but one should try. The entry in the table is there for a good reason.
With C1, C2, CT, NC1, NC2, and T1 known we can calculate the remaining entries T2, NCT and T in the table.
This table gives an overview of excess mortality.
Note: When filling the table in a specific situation one can argue over the estimates. Disagreement on the estimates however should not lead to discarding the presented method.
Example
Note: The figures and estimates in this example are hypothetical. For an actual calculation for the years 2020/21/22 in the Netherlands see hanslugtigheid.nl/excess-mortality-is-strongly-underestimated/
Suppose in a country every year 100.000 people die. In the first year of the pandemic 17.000 people die from covid. In total 113.000 people die. So the annual excess mortality is 13.000. Suppose this excess mortality is mostly attributed to covid – say 12.000. Hence there is a 1.000 excess mortality from other causes. Then 17.000 – 12.000 = 5.000 people who died from covid in 2020 would also have died in 2020 at a later moment. For example people who died in April with the first wave and who would have died in October without the pandemic. Also people died earlier in 2020 from other causes than covid. For example from psychological reasons or not seeing a doctor. Estimate their numer at 1.000.
Then for the total excess mortality covid/non-covid and annual/’in same year’ we get the following table.

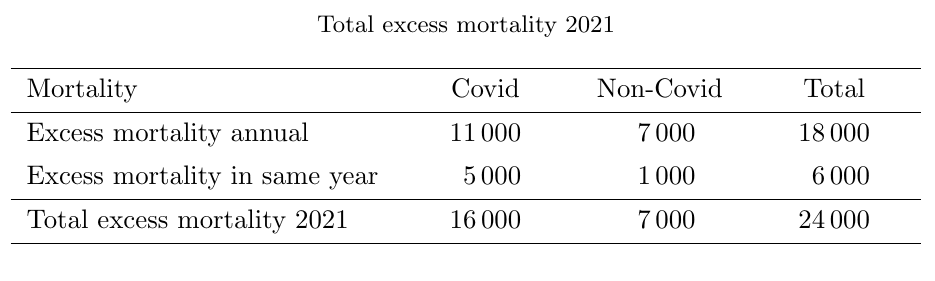
Now look at the year 2021.
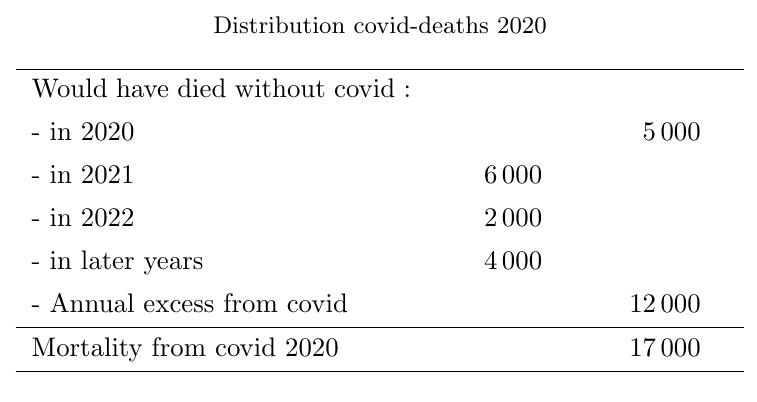
The relevant question to ask is: ‘When would people who died from covid in 2020 have died without the pandemic?’. We already have the 5.000 in-year mortality for 2020. Suppose we estimate that from the remaining 12.000 excess mortality in 2020 from covid 6.000 would have died in 2021 without the pandemic, 2.000 in 2022 and 4.000 in later years. We then get the following table.
For 2021 the expected mortality was 100.000. From those 6.000 died in 2020 from covid. So expected mortality in 2021 is 94.000. Suppose actual mortality in 2021 was 112.000. Then annual excess mortality for 2021 equals 18.000. Suppose mortality from covid was 16.000, from which an estimated 5.000 also would have died in 2021 without the pandemic and 11.000 would have died in a later year. Then 7.000 (18.000 – 11.000) is the excess mortality from other causes than covid. Also suppose 1.000 people died earlier in 2021 than without the pandemic. Then we get the following table for 2021.